- test characteristics of populations without referring to specific parameters
- designed to test ordinal data
- when data is ordinal, the mean is not an appropriate measure of central location
- does not need data to be normally distributed
- Nonparametric is distribution free statistics
- test population locations
Wilcoxon rank sum test
- compare two populations
- samples are independent
- data are ordinal or interval
- test whether population distributions are identical or not
- in locations and shapes, spreads (variances)
Sign test
- samples are matched pairs
- compare two populations of ordinal data in a matched pair
Wilcoxon signed rank sum test
- samples are matched pairs
- compare two populations of interval data in a matched pair
Kruskal Wallis Test
- compare two or more populations
- data are ordinal or interval
- data from independent samples
Friedman test
- compare two or more populations
- data are ordinal or interval
- data from randomised block experiment
Spearman rank correlation coefficient
- test whether relationship exists between two variables
- ordinal or interval data
Analysis of Variance (ANOVA)
- compare two or more population means
- by analyzing sample variance
- of interval data
- from independent samples or blocked samples
- populations are referred to as treatments
SST - sum of square for treatment
- between treatment variation
SSE - sum of square error
- within treatment variation
MST = SST / (k-1)
MSE = SSE / (n-k)
test statistics F = MST / MSE
- if F larger than Fcritical, reject H0
- if p value less than significance, reject H0
independent samples - one way ANOVA
blocked samples - two way ANOVA
Inference
- when population variance is known or given
use Z = (x̄ - u ) /(σ/√ n)
- when population variance is NOT known
use t = (x̄ - u ) /( s/√ n)
z statistics is:
 and
and 
when z statistics is replaced by t statistics, t statistics is:
 and
and
use s : sample std deviation instead of population std deviation
- t stat assume data is normal
and the confidence interval estimator of u is:

- test population proportion


Two Populations Inference
- assume populations are normally distributed
-test the variances are equal or not
use F-test
-if variances are equal
use t-statistics
-Else if variances are unequal
use t-statistics
Chi Squared Test
- multinomial experiment
- goodness of fit test
- nominal data
- test about population's variability
Sampling and Estimation
- central limit theorem
for a large enough sample size, the distribution of sample mean is approximately normal
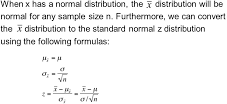
the probability of Z within the significance level of α
P(-Zα/2 < Z < Zα/2) = 1 -α
Example:
The student salary distribution with mean 500, variance 10
Qn: what fraction of students earn more than 520?
Ans:
P( (x̄ - u ) /(σ) > (520 - 500)/ 10 ) = P(Z > 2) = 1 - 0.9772 = 0.0228
(for population, don't need to know n)
Qn: 93.32% of students earn less than me, how much do i earn?
Ans: find Z from 0.9332, so Z = 1.5
then calculate (x̄ - 500)/ 10 = 1.5 => x̄ = 515
No comments:
Post a Comment